Household consumption is still the biggest source of economic growth in Indonesia today. Especially when there are moments of holidays and public mobility during long holidays.
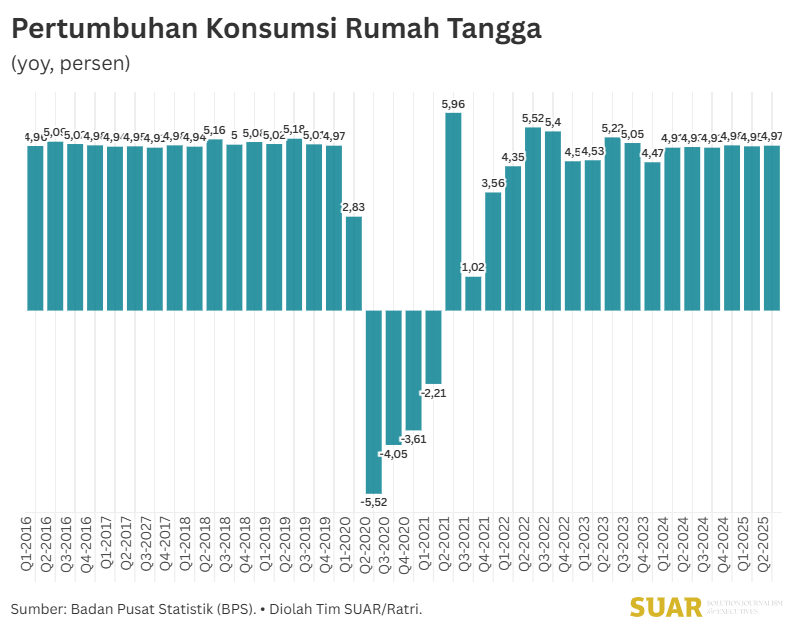
Data from the Central Statistics Agency (BPS) shows that household consumption growth has remained consistent or stable at around 4.9% since 2024. In the second quarter of 2025, household consumption amounted to 4.97% (annualized), slightly up compared to the first quarter of 2025 at 4.95%. The highest growth ever occurred in Q3-2021, during the post-pandemic period, at 5.96%.
When viewed by type, consumption components that experienced an increase in the second quarter of 2025 included food and beverages, health and education, transportation and communication, and consumption in restaurants and hotels.
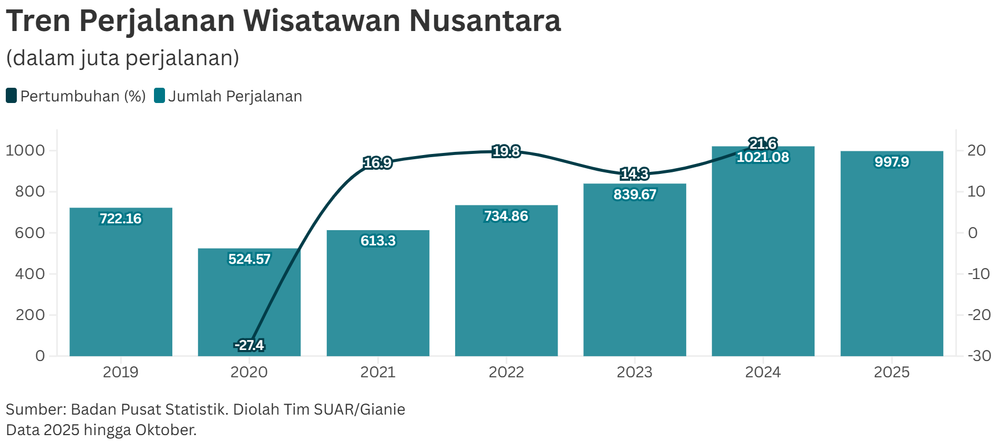
Based on BPS information, the 4.15% growth in food and beverage consumption was due to tourism activities during the religious holiday period (Eid al-Fitr, Vesak, Ascension of Jesus Christ, Eid al-Adha) and the school vacation period. Well, the increased mobility of the community during the holiday period has driven an increase in transportation and communication consumption (grew 6.48%) as well as restaurant and hotel consumption (grew 6.77%).
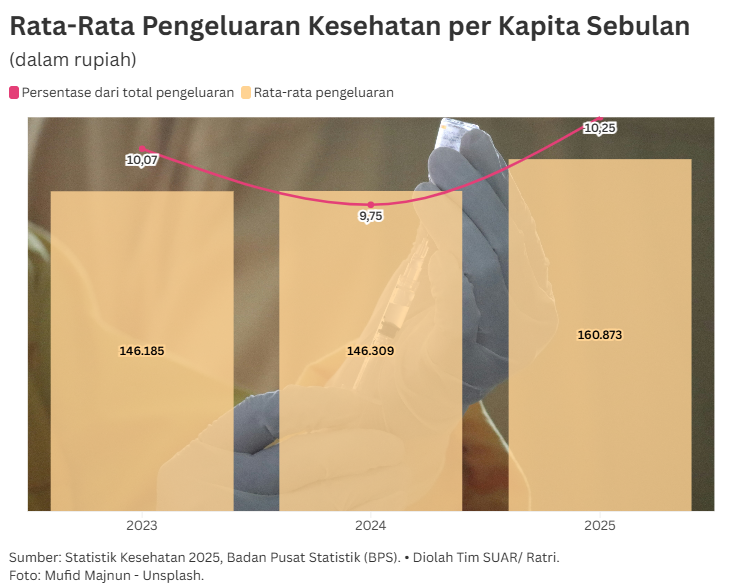
Consumption related to health and education also increased. Namely, it grew by 4.16%.
Interestingly, the data for Q2-2025 shows that consumption patterns have changed. There were two expenditure groups that declined. Namely, consumption of clothing and footwear and consumption of housing and household equipment.
Consumption of clothing and footwear declined from 6.86% (first quarter) to only 2.91% (second quarter). The consumption of housing and household equipment fell from 5.06% to 4.34%.
The increase in food and beverage consumption, while the consumption of clothing and footwear declined, could explain two things. First, consumption of foodstuffs classified as primary is still a priority over consumption of goods classified as secondary needs, such as clothing and footwear.
Secondly, the pattern also explains the Rohana (the group only asks questions) and Rojali (the group rarely buys) phenomenon that has been buzzing lately. The phenomenon where consumers prioritize eating and drinking needs when going to a shopping center or mall over secondary items.
This consumer behavior can be a consideration for business actors in choosing the right business development strategy.